


SEJournal Online is the digital news magazine of the Society of Environmental Journalists. Learn more about SEJournal Online, including submission, subscription and advertising information.
October 6, 2021

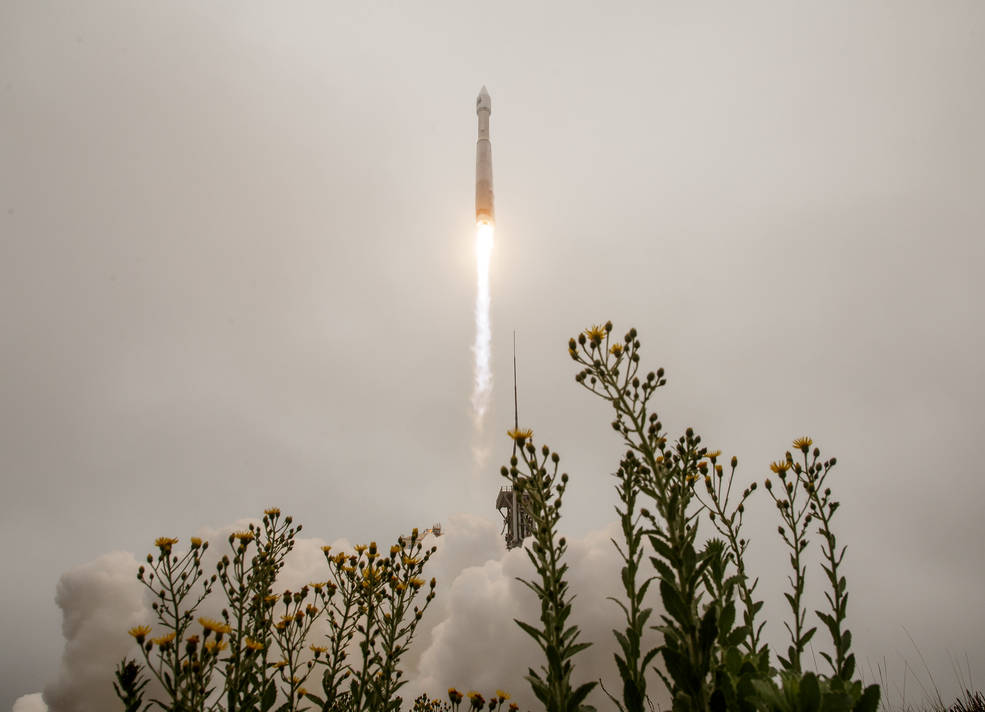 |
| NASA’s Landsat 9 satellite, which continues a program to monitor Earth’s land and coastal regions that can be used by reporters covering environmental trends, was launched on Sept. 27, 2021, from Vandenberg Space Force Base in California, shown above. Photo: NASA/Bill Ingalls. Click to enlarge. |
Reporter’s Toolbox: New Landsat 9 Offers Variety of Resource Stories
By Joseph A. Davis
Environmental journalists may lack resources at times. But they do have at least one — whiz-bang satellites to help them explain how Earth is changing.
And NASA just launched another one. Landsat 9, the latest in the almost 50-year-old series, went up Sept. 27. After about three months of shakedown and calibration, it will be regularly downloading data to anyone who asks.
And yes, ordinary journalists can get stories from it, though they may work better with tech-savvy collaborators.
Where the data comes from
Two earlier models, Landsat 7 and 8, are still up there and working (although 7 is slated to retire). These look at Earth’s land surface with pretty fine, 15 meter resolution, in at least nine bands of the light spectrum, returning to the same spot every 16 days or so.
The result is millions of images. Most importantly, the 50-year time series allows evidence-based conclusions about how Earth is changing (and being changed), not just globally but locally too. The Landsat 8 press kit and an image gallery give some idea of what is possible.
The Landsat series is focused on land, but there are other Earth-observing satellites. Some look at the weather, the atmosphere or the ocean. And some commercial and ex-spy satellites have even finer resolution.
Landsat can show trends
in agricultural crops, wetland
loss, urbanization, suburban
sprawl, drought and more.
That means Landsat can show trends in deforestation (or afforestation or reforestation), forest health, agricultural crops and cover, other vegetation and cover, coastal erosion, wetland loss and restoration, soil and rock, urbanization, suburban sprawl, drought and flooding, and more.
It can also map the growth and retreat of glaciers, ice sheets and shelves, wildfire impacts, coral reefs, and lots of other natural resource features.
The secret sauce for sophisticated imaging is that it is multispectral. Different geographic features can be distinguished by their wavelengths (or signature combinations thereof). The satellites have sensors that collect light from many separate bands or wavelengths — not just visible light but infrared.
Using the data smartly
Access to Landsat data without charge was not always a given. Until 2008, even researchers had to pay for Landsat images.
The U.S. Geological Survey, which runs the data part of the program once Landsat instruments are launched and working, made it free at that time. But it is considering going back to pay-for-data. So use it or lose it.
Meanwhile, USGS has made Landsat data easier to both get and to use. There’s a handy webpage that shows you most of the access menu options, organized so that scientific researchers who can handle vast amounts of data can get that, but so ordinary people who may just want to look at a specific area in specific ways can easily narrow it down.
One handy way to start exploring what is available is a viewing tool called LandsatLook 2.0. It allows you to zoom in on a specific area or time, not to mention choosing your spectrum and layering other geographic features onto the Landsat map.
Unless you are a data journalism specialist, you might do well to seek sources, experts and collaborators to guide you through the data. Look for gurus in the geography, forestry and natural resources departments of your local universities. Or find project leaders at relevant government agencies who do research in your area of interest.
Today, many larger news media enterprises have data journalism specialists or teams who may collaborate. Check in with the Investigative Reporters and Editors’ team at the National Institute for Computer-Assisted Reporting, or NICAR.
Story leads and examples
Satellite imagery (not from Landsat though) helped reporter Ana Ionova do a 2020 series on loss of the Amazon rainforest in Mongabay that won recognition from the Society of Environmental Journalists.
More recently, NPR’s California Newsroom and Stanford University’s Environmental Change and Human Outcomes Lab used satellite data to examine the toxic effects of wildfire smoke.
And just this September, the Allen Coral Atlas announced the completion of its satellite-based atlas of coral bleaching.
You can find a lot more examples of how satellite imaging can be used in journalism projects in this paper.
You might also take a look at what SkyTruth is doing. It’s a nonprofit watchdog that uses satellite data to examine environmental issues. An example is its study of mountaintop removal mining in Appalachia. Find further suggestions (and more here) on developing satellite journalism stories.
Joseph A. Davis is a freelance writer/editor in Washington, D.C. who has been writing about the environment since 1976. He writes SEJournal Online's TipSheet, Reporter's Toolbox and Issue Backgrounder, and curates SEJ's weekday news headlines service EJToday and @EJTodayNews. Davis also directs SEJ's Freedom of Information Project and writes the WatchDog opinion column.
* From the weekly news magazine SEJournal Online, Vol. 6, No. 35. Content from each new issue of SEJournal Online is available to the public via the SEJournal Online main page. Subscribe to the e-newsletter here. And see past issues of the SEJournal archived here.
SEJ Publication Types:
Topics on the Beat:
Region:
Visibility: