


SEJournal Online is the digital news magazine of the Society of Environmental Journalists. Learn more about SEJournal Online, including submission, subscription and advertising information.
April 19, 2023

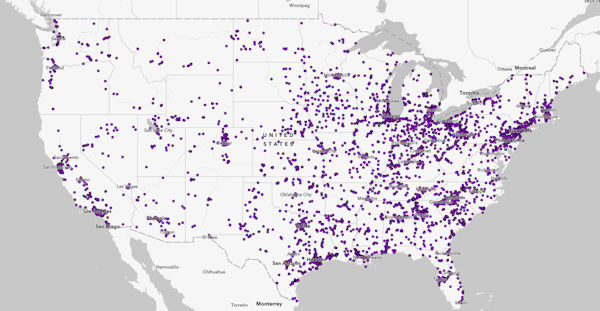 |
| An interactive map version of the database shows where industrial facilities that use chemicals are concentrated, and allows users to click down to find the ones in their area. Image: U.S. Environmental Protection Agency. |
Reporter’s Toolbox: New TSCA Chemical Data Can Help Deepen Reporting
By Joseph A. Davis
Environmental journalists hoping to illuminate the health and environmental impacts of industrial chemicals in the United States have a new(ish) database to help them. Welcome to the Chemical Data Reporting National Review.
Forget for just a moment the more familiar Toxics Release Inventory, or TRI, which was created as part of the Emergency Planning and Community Right-to-Know Act.
The Chemical Data Reporting National Review, or CDR, was developed under the Toxic Substances Control Act — most importantly the revision of TSCA enacted in 2016. This is the CDR’s first reporting cycle under the new act and that makes all the difference.
The two databases — like the two laws that established them — have different purposes.
TRI encompasses toxic chemicals. Its data is legally required to be made public. The CDR, on the other hand, focuses on the highest-volume chemicals in production and commerce — some toxic, some safe and some whose toxicity is still unknown. Not every bit of data or every chemical is included, and some are hidden because of “confidential business information” claims.
Where the data come from
Facilities that meet the criteria are legally required to report CDR data to the U.S. Environmental Protection Agency every four years, so they could be penalized for false reports. Moreover, the EPA has a serious data quality assurance program.
The 2020 CDR shows more than
7.2 trillion pounds of chemicals
manufactured or imported at 5,238 sites.
Right now, there are some 8,649 individual chemicals in the CDR. They tend to be the higher-volume chemicals used in U.S. industry. Many are imported. The 2020 CDR shows more than 7.2 trillion pounds of chemicals manufactured or imported at 5,238 sites.
But CDR data is only collected every four years. The data just released this year actually come from data year 2020. So the previous database, from data year 2016, was really not influenced much by the new TSCA law, as was the new data. Because the CDR program has evolved, you may find it hard to match data from previous years to current data.
Also, facilities aren’t tracked in the CDR unless they handle chemicals in quantities above a certain threshold. So small ones are missing. Still, the data do a better job than the TRI at showing you how widely chemicals are used in making things, even as intermediates. It also offers a starting point for inquiries about possible worker exposure to chemicals.
CDR documents acknowledge the EPA did not do as good a job as it wanted to because of a lack of funds. We credit the agency for trying to display “community characteristics” as part of its map presentation. But if you are really going down the environmental justice rabbit hole, you may want to use better demographic layers. Why not start with the EPA’s own EJScreen (which we have written about)?
How to use the data smartly
Perhaps the simplest and easiest way to use the CDR is just to scan the “2020 CDR National Review,” which gives you a summary and trends, as well as insight into how the chemicals are used in production, summaries for chemical groupings, etc.
The good news, though, is that the data itself is downloadable (raw data, minus confidential business information, are available in Excel, Access and CSV formats). The bad news is that it is not searchable online. Well, except for this separate database.
Yet the EPA touts it as “more accessible.” This claim rests mostly on the interactive map, which shows you where industrial facilities that use chemicals are located (and concentrated) — and allows you to click down to find the ones in your area of interest.
But it is hard to infer many conclusions about public exposure to the chemicals — whether at the fenceline or farther away. The CDR will do more for you if you match it up with other databases. You may choose to focus on the higher-risk chemicals.
It will also be more fruitful if you can apply knowledge of the complex and obscure workings of TSCA, which has had all kinds of problems in recent years.
Learn more about the overall CDR program and access the CDR data. There’s also a data dictionary and basic info about the database, plus coaching from the EPA on how to use the database.
Joseph A. Davis is a freelance writer/editor in Washington, D.C. who has been writing about the environment since 1976. He writes SEJournal Online's TipSheet, Reporter's Toolbox and Issue Backgrounder, and curates SEJ's weekday news headlines service EJToday and @EJTodayNews. Davis also directs SEJ's Freedom of Information Project and writes the WatchDog opinion column.
* From the weekly news magazine SEJournal Online, Vol. 8, No. 16. Content from each new issue of SEJournal Online is available to the public via the SEJournal Online main page. Subscribe to the e-newsletter here. And see past issues of the SEJournal archived here.
SEJ Publication Types:
Topics on the Beat:
Region:
Visibility: