


SEJournal Online is the digital news magazine of the Society of Environmental Journalists. Learn more about SEJournal Online, including submission, subscription and advertising information.
April 5, 2023

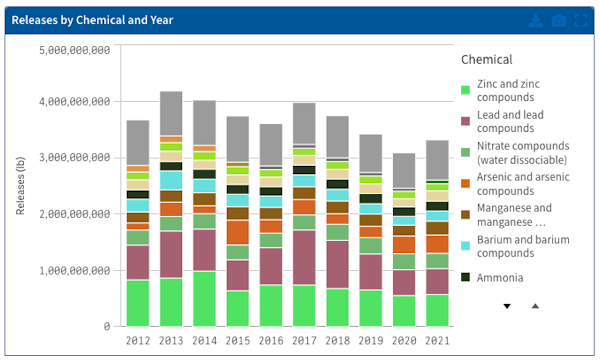 |
| A chart from the Toxics Release Inventory tracker showing releases by chemical for the last 10 years. Image: U.S. Environmental Protection Agency website |
Reporter’s Toolbox: Latest TRI Data Can Charge Up Local Stories, Including on PFAS
By Joseph A. Davis
Toxic substances near you? There’s an app for that. The U.S. Environmental Protection Agency has just released the latest full Toxics Release Inventory, or TRI.
As every year, it can spark important stories. But this year is different — partly because the chemical news is different. The data in the latest TRI are from reporting year 2021. That was the first year that toxic PFAS “forever” chemicals were included in the survey.
Where the data come from
The TRI was mandated by Congress in the Emergency Planning and Community Right-to-Know Act of 1986, a response to the Bhopal disaster. The TRI went online before the internet was a thing. And was arguably what brought data journalism to the environmental beat.
In a broader sense, the data come from a nearly 40-year struggle over public access to information about chemical risk.
The chemical industry and others tacitly agreed in 1986 to more risk disclosure in return for keeping the feds from regulating the chemical risks themselves (though they have lobbied to weaken the TRI since then).
Over the years, the list of
chemicals has broadened
to take account of new concerns.
Over the years, the list of chemicals has broadened to take account of new concerns. That was often a struggle, too.
In any case, the law requires certain facilities (not just chemical plants) to report annually to the EPA the amounts of certain toxic chemicals they handle. Under current EPA rules, the requirement covers more than 21,000 facilities handling specified amounts of listed chemicals. The current list contains 787 individual chemicals and 33 chemical categories.
The EPA then cleans up the data and publishes it (here’s this year’s announcement). Also, each year when it is published in final form, the EPA also offers its own national analysis.
Plus, there’s a search portal, and you can also explore the TRI website, along with the full database, which is online and downloadable.
How to use the data smartly
If you think TRI data can’t lead to good stories, check out ProPublica’s blockbuster 2021 feature project Sacrifice Zones. The TRI has evolved to make stories like this more feasible.
The main thing is making the connection between toxic chemicals and the people who may be vulnerable to them. This year’s TRI is more map-based than ever and aware of demographics near facilities.
Yes, it’s an environmental justice story — look around for schools, nursing facilities and even drinking water sources. But remember that “release” of a toxic substance is quite different than human exposure or health consequences.
Here are some suggestions of questions to ask and resources to pursue so TRI data can help make stories for you.
- What geographic area encompasses the audience you are writing for? It may be a state, but could also be a metropolitan area, an airshed, a watershed, an industrial area or a minority area. Use TRI’s search criteria and mapping ability to highlight this dimension.
- What are the main industries in your area handling toxic substances? In one area, it might be plastics. In another, mining. Or petroleum refining. Focusing on this industry can lead to deeper stories.
- What are the vulnerable populations in your area? Look for areas where people may lack the political power to influence siting of facilities. Look for protests and lawsuits about the siting of facilities. Use the new demographic overlays in the TRI to explore.
- Who is using PFAS in your area? What does the TRI tell you about the quantity of these chemicals being handled — or being released? What happens to any PFAS that are released?
- Can you figure out which (if any) toxic releases are not legally regulated by other laws that the EPA administers? Check the facilities of concern against other EPA databases using ECHO, Envirofacts or others. What happens to these releases and how do they affect people?
- Which (if any) toxic substances from your sites of concern are disposed of on site, either by burial or by underground injection? Are these activities done under permits or regulation? What happens after they are “released”?
- Take a look back at previous years of TRI data for your sites of concern. Have new pollutants shown up in recent years? Are the amounts of releases trending up or down?
- Try exploring EPA’s TRI Toxics Tracker tool. What can it tell you about releases on tribal land or other geographic categories?
- Take a look at other facilities of the companies that release toxic substances in your area. Is the company international, nationwide, regional?
- Take a look at EPA’s “What you can do” page for the TRI.
- For environmental justice issues, explore some of the other EPA data tools that are based on TRI data (plus other factors). One is EJScreen (which SEJournal’s TipSheet has written about before).
- If you are pursuing an environmental justice story, give the new White House EJ data tool a whirl. It has limitations, such as the absence of race as a parameter. Its intended use was to describe whether various streams of federal money are being distributed fairly.
- Don’t assume that the only toxic substance releases are from chemical plants. The chlorine at a water treatment plant or the ammonia at a large refrigeration plant can be risky, too. Some of these are in TRI.
[Editor’s Note: Check out our most recent TRI-related Toolbox, “Why the Latest TRI Update Should Be in Your Sights for Stories,” as well as our story on how an obscure toxic substance database was used to ID a loophole on PFAS. In addition, SEJournal has published many Toolboxes and TipSheets on using TRI over the years. See, for instance, “Early Toxics Release Inventory Data Can Yield Scoops,” “Mapping Toxic U.S. Hotspots Down to the Neighborhood Level,” “Toxics Database a Key Tool for Environmental Journalists,” “TRI National Analysis Dangles Leads for Investigative Stories” and “Use EPA TRI Database To Find Toxic Threats.” Also follow EJToday headlines on chemicals and toxics.]
Joseph A. Davis is a freelance writer/editor in Washington, D.C. who has been writing about the environment since 1976. He writes SEJournal Online's TipSheet, Reporter's Toolbox and Issue Backgrounder, and curates SEJ's weekday news headlines service EJToday and @EJTodayNews. Davis also directs SEJ's Freedom of Information Project and writes the WatchDog opinion column.
* From the weekly news magazine SEJournal Online, Vol. 8, No. 14. Content from each new issue of SEJournal Online is available to the public via the SEJournal Online main page. Subscribe to the e-newsletter here. And see past issues of the SEJournal archived here.
SEJ Publication Types:
Topics on the Beat:
Region:
Visibility: