


SEJournal Online is the digital news magazine of the Society of Environmental Journalists. Learn more about SEJournal Online, including submission, subscription and advertising information.
November 12, 2025
 |
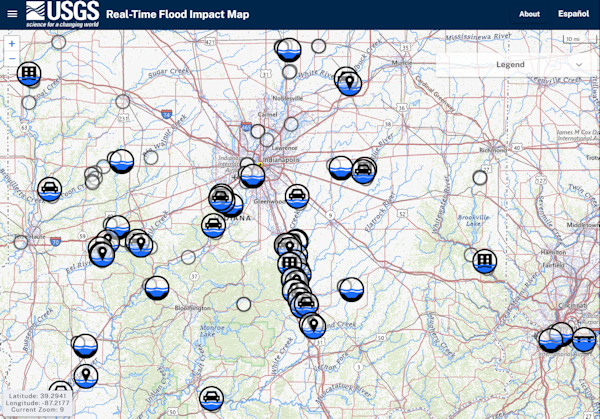 |
| A screenshot of the USGS Real-Time Flood Impact Map on April 9, 2025, near Indianapolis, Indiana, where multiple streams and rivers experienced spring flooding. Image: U.S. Geological Survey (United States government work). |
Reporter’s Toolbox: Database of Flood Events Helps Cover Catastrophes, Past or Present
By Joseph A. Davis
Has your community ever had a flood? Do you need to report on it? The data hounds at the U.S. Geological Survey can tell you a lot about it.
The USGS does a lot more than print those topo maps you take on wilderness hikes. It has massive troves of water data, too. Some of it goes all the way back to 1888. Its network of stream gages covers most of the significant streams in the United States.
But there’s a whole lot more. Check out the USGS Flood Event Viewer, for starters. It covers more than just streams — also coastal, lake and wetland flooding, storm tides, wave heights, … you name it.
The long historical record covered by the data allows you to figure out how your immediate flood compares to past events.
Where the data comes from
The USGS stream gage network gets real-time data from more than 12,000 stream gages nationwide. And that covers just a tiny 1% of all the streams nationwide. It broadcasts stream flow and volume data to an online database.
You can get the overview at the USGS National Water Dashboard.
The flood event viewer also contains current and historical flood alert information. Plus tidal and hurricane information, and more.
The quality of the data is the best
you can find anywhere. These people
are scientists. Most of the data are
actual instrument measurements.
The quality of the data is the best you can find anywhere. These people are scientists. Most of the data are actual instrument measurements. And there’s a lot more to it if you are a water geek.
One word of caution: The Trump 2.0 White House has been trying to make some significant cuts in USGS’s infrastructure — so get it while you can.
The data is online, searchable and fully downloadable. It is very well documented.
USGS collaborates on this project with state, local and other federal agencies — which may also be important sources for your story. Among them is the National Weather Service, which has its own flood alert mechanisms.
How to use the data smartly
One nifty feature of the flood data portal is that you can configure it to send you alerts via smartphone and email. So you can be up on breaking events and trigger alerts by thresholds you choose. See the WaterAlert page here.
The flood event viewer is linked to another very useful USGS dataset: the Flood Inundation Mapping toolbox, which geomaps the areal extent of specific flood hazards.
This viewer can probably help you compare any catastrophe you are currently covering with floods from times past.
A lot will depend on the story you are doing. Flooding on the Lower Mississippi is a very different kettle of catfish than flooding on Chesapeake Bay.
As usual, we urge you not to rely on data alone for your reporting. Put on your rubber boots and visit the water (but don’t take risks on swift streams). Talk to emergency responders and flood victims. Look for the muddy high-water mark on the bridge. Groundtruth whatever you can.
[Editor’s Note: For more, see our recent Issue Backgrounder, “Coastal Flooding Challenges Cities Around the U.S.” Also check out Reporter’s Toolboxes on mapping flood risk, understanding storm surge maps and using data sources to track climate-driven mayhem at Superfund sites. Plus, look for other past flood coverage, including TipSheets on inland flooding, extreme rainfall, a checklist for flood readiness, flood-resistant building construction, building in flood plains, the public health threat of combined sewer overflows and how extreme weather amplifies hazardous waste threats, a book author interview on the history of rain and a feature on the inequities of flooding. And don’t forget to visit our Topic on the Beat pages on Disasters and Water & Oceans, and get EJToday headlines on extreme rain and flooding.]
Joseph A. Davis is a freelance writer/editor in Washington, D.C. who has been writing about the environment since 1976. He writes SEJournal Online's TipSheet, Reporter's Toolbox and Issue Backgrounder, and curates SEJ's weekday news headlines service EJToday and @EJTodayNews. Davis also directs SEJ's Freedom of Information Project and writes the WatchDog opinion column.
* From the weekly news magazine SEJournal Online, Vol. 10, No. 40. Content from each new issue of SEJournal Online is available to the public via the SEJournal Online main page. Subscribe to the e-newsletter here. And see past issues of the SEJournal archived here.
SEJ Publication Types:
Topics on the Beat:
Region:
Visibility: