


SEJournal Online is the digital news magazine of the Society of Environmental Journalists. Learn more about SEJournal Online, including submission, subscription and advertising information.
December 4, 2019

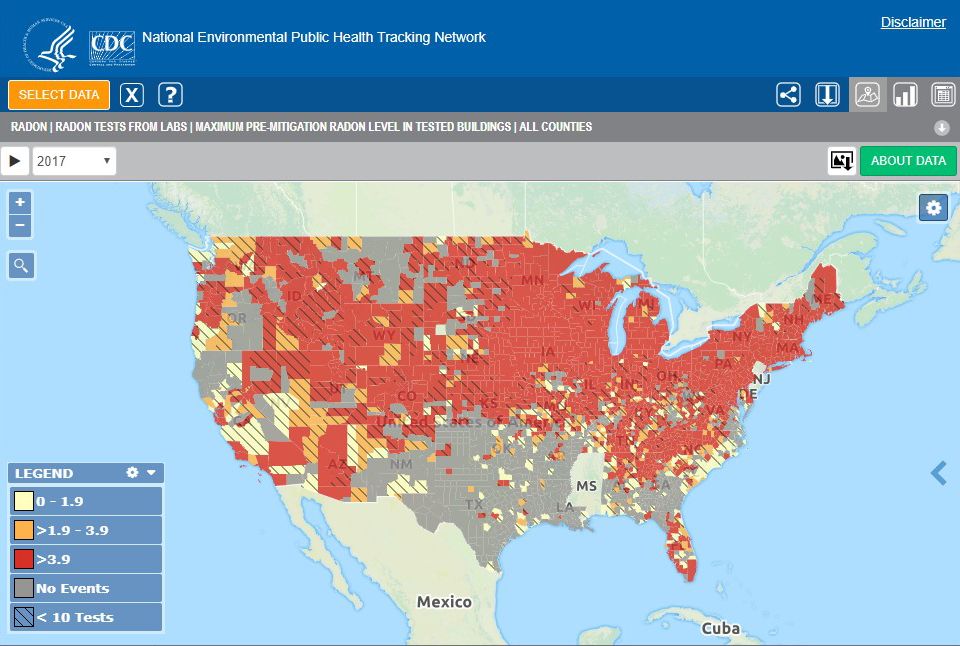 |
| The Centers for Disease Control and Prevention’s Environmental Public Health Tracking Network has radon testing data at the state and county level for most of the continental United States. Image: CDC/National Center for Environmental Health. Click to enlarge. |
Reporter’s Toolbox: Data Sources a Jumping-Off Point for Radon Stories
By Joseph A. Davis
Environmental journalists can be grateful for the availability of data on where naturally occurring radon can potentially affect people’s health. The government did something right.
This naturally occurring radioactive gas can seep into people’s basements and homes. According to the National Institutes of Health, it causes an estimated 15,000 to 22,000 lung cancer deaths each year.
[Editor’s Note: See our Nov. 27, 2019, TipSheet on “Radon — The Forgotten Environment Story.”]
Radon can be a localizable story. It occurs in geological formations and the water they contain as a result of the decay of naturally occurring radioactive elements. But geology varies dramatically from place to place, and some localities are at far greater risk of radon exposure than others.
Also, once radon is identified, there is a lot that can be done to mitigate it.
Where the data comes from
You can kick-start your coverage with some handy and user-friendly databases. There is a shiny new database from the Centers for Disease Control and Prevention, which has data that’s part of a tracking network for a wider array of environmental public health problems.
One good thing about the CDC database
is that it explains transparently where the
data came from — and how good it may be.
One good thing about the CDC database is that it explains transparently where the data came from (a variety of sources) — and how good (or imperfect) it may be.
Some of the data comes from state labs. Some comes from private labs that process home test kits sold to consumers.
Another good place to get geographically specific radon data is the U.S. Environmental Protection Agency. To get data from EPA, start here.
Your state environmental agency may have more detailed surveys of radon occurrence.
One fairly good source for data on radon in drinking water is the Environmental Working Group.
How to use the data smartly
The CDC data is presented on the web in map format, which makes it easy to reconnoiter the area you are interested in.
You can also see median and peak values, and select for pre-mitigation or post-mitigation values. Data are viewable down to the county level.
A caveat: As in all data journalism projects, you should remember that the data is just a starting point for further reporting.
Joseph A. Davis is a freelance writer/editor in Washington, D.C. who has been writing about the environment since 1976. He writes SEJournal Online's TipSheet and Reporter's Toolbox columns. Davis also directs SEJ's WatchDog Project and writes WatchDog Tipsheet, and compiles SEJ's daily news headlines, EJToday.
* From the weekly news magazine SEJournal Online, Vol. 4, No. 44. Content from each new issue of SEJournal Online is available to the public via the SEJournal Online main page. Subscribe to the e-newsletter here. And see past issues of the SEJournal archived here.
SEJ Publication Types:
Topics on the Beat:
Region:
Visibility: