


SEJournal Online is the digital news magazine of the Society of Environmental Journalists. Learn more about SEJournal Online, including submission, subscription and advertising information.
March 13, 2024
 |
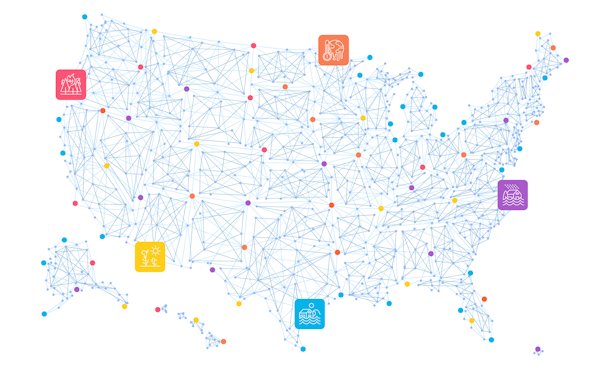 |
| The Climate Mapping for Resilience & Adaptation tool offers a wide array of data and information sources, and granular insights for local environmental reporters. Image: Screenshot, CMRA website. |
Reporter’s Toolbox: Map Model Offers Up Data on Climate Disaster-Proofing
By Joseph A. Davis
There’s a new, data-rich tool to help journalists report on how well U.S. communities are preparing for the harmful effects of climate change. It’s a winner (although because it’s a U.S. government production, we worry whether it would survive a second Trump presidency).
The Climate Mapping for Resilience & Adaptation tool compiles data and information about how U.S. areas are threatened by climate change — and what they have (or haven’t) done to head off its worst harms. You can access it here.
The secret treasure it offers data geeks
is the wide array of well-documented data
and information sources that go into it.
Journalistically, it’s useful right out of the box. But the secret treasure it offers data geeks is the wide array of well-documented data and information sources that go into it. Each one of them could be a Reporter’s Toolbox in and of itself.
One advantage for local environmental reporters is the granularity of CMRA — it goes down to the census tract (neighborhood) level. Even though that fine resolution may not always be meaningful, it is often an advantage if you are writing about local impacts.
Where the data comes from
The organizer of this project is the U.S. Global Change Research Program, an interagency White House office that brings together the work of some 15 federal agencies.
They are also the ones who produce the National Climate Assessment. And if you know what the National Climate Assessment is, you know that it, and the USGCRP, have repeatedly been assaulted by GOPers and the fossil fuel industries. To the point where the Bush-Cheney White House literally tried to unpublish the first assessment.
Anyway, all the data from the CMRA comes from federal agencies, so it is quite reliable. You don’t just get data; you get model results and multilayer assessments.
But step back and look at another aspect of the CMRA — its data sources section, which lists the many sources that go into CMRA. Among them are these:
- Census data: Not only does CMRA include census tract data (which means demographics), but it also includes the Census Tribal Boundary and Annexation Survey.
- Multiple scenarios: Because we are talking about what climate warming may bring us in the future, CMRA includes projections by models. The scenarios are of multiple time periods and multiple economic conditions.
- NOAA sea level rise maps: CMRA includes complex estimates of coastal inundation from the National Oceanic and Atmospheric Administration.
- National Levee Database: This database includes only federally managed levees in flooding estimates.
- FEMA National Flood Hazard Layer: The Federal Emergency Management Agency, which engages in response to flood disasters, keeps maps of flood hazards for its multiple purposes.
- CEQ Economic Justice Data: The White House Council on Environmental Quality has set up a scoring system to identify disadvantaged communities that may receive federal aid.
- Building Code Adoption Tracking: FEMA maintains a database tracking municipal and county building codes as to what level of disaster-proofing (if any) they have required.
How to use the data smartly
The point of this data site is partly to help you localize (or regionalize) the impacts of climate heating. But it would be a mistake to imagine that CMRA alone will do the job for you. As good as it is, there are many impacts left out. That’s OK, because this information can be found elsewhere.
For example, some hurricane damage is not just water-related but wind-related. Look for it at the National Centers for Environmental Information, the National Weather Service or FEMA.
Another example would be climate-related health impacts, whether from heat illness, vector-borne diseases or others. Start with the Centers for Disease Control. There’s more: We could easily point to drought impacts, wildfires or insurance rates.
As always, we urge you to remember that the best journalism will go beyond the data to include other kinds of reporting. Be scrupulous in phrasing probabilistic statements. It is wise to groundtruth everything you can.
Joseph A. Davis is a freelance writer/editor in Washington, D.C. who has been writing about the environment since 1976. He writes SEJournal Online's TipSheet, Reporter's Toolbox and Issue Backgrounder, and curates SEJ's weekday news headlines service EJToday and @EJTodayNews. Davis also directs SEJ's Freedom of Information Project and writes the WatchDog opinion column.
* From the weekly news magazine SEJournal Online, Vol. 9, No. 11. Content from each new issue of SEJournal Online is available to the public via the SEJournal Online main page. Subscribe to the e-newsletter here. And see past issues of the SEJournal archived here.
SEJ Publication Types:
Topics on the Beat:
Region:
Visibility: