


SEJournal Online is the digital news magazine of the Society of Environmental Journalists. Learn more about SEJournal Online, including submission, subscription and advertising information.
April 20, 2022

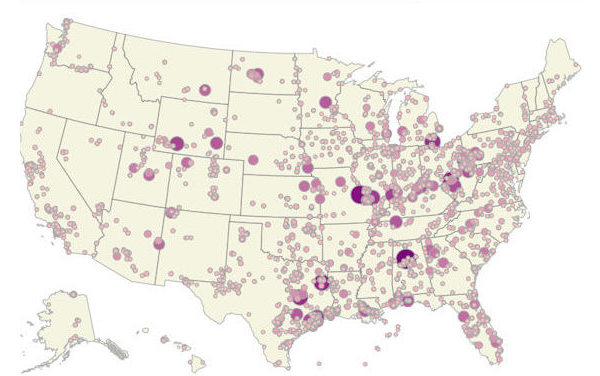 |
| U.S. emissions by location. Image: U.S. EPA Greenhouse Gas Reporting Program. |
Reporter’s Toolbox: Newly Released Greenhouse Gas Inventory Offers Local Reporting Opportunities
By Joseph A. Davis
The latest U.N. report on climate reminds us that numbers matter, even if it’s just to report an apocalyptic overview.
But it’s also worth noting that last week, the latest numbers on U.S. greenhouse gas emissions were released as well. And some things at least appear good. Total U.S. emissions for 2020, the latest data year, are down by some 11 percent from the previous year (but don’t break out the champagne — that mostly reflects the pandemic-driven economic downturn).
Either way, environmental journalists can make use of the numbers to drill down for local news.
Where the data comes from and how to use it smartly
The U.S. Environmental Protection Agency has compiled this report, the Inventory of U.S. Greenhouse Gas Emissions and Sinks (GHG Inventory), each year since 1990.
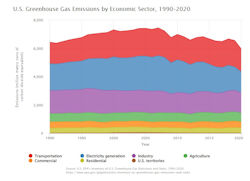 |
| Greenhouse gas emissions by sector from 1990-2020. Image: U.S. EPA. |
The time series could be useful, although the story it tells isn’t that inspiring. Looking at this 40-year timeline (image at right), it’s clear U.S. emissions are not taking the rapid nosedive needed to avoid the worst effects of climate change.
One effective use of the GHG data is to focus down to the facility level.
Some 8,000 major facilities are required, by law, to report their emissions. That means those numbers represent something very close to actual measurable emissions, while other numbers may be more like estimates.
The data are also categorized by sectors: transport, commercial, electric generation, residential, industry, U.S. territories and agriculture. Industry sectors include petroleum, refining, food processing, landfills and many others.
There is a viewing portal, the “Facility Level Information on GreenHouse gases Tool (FLIGHT),” which allows reporters to get down to facilities in a particular county. View the data by gas or by emission amount. Or download the entire dataset to play with it at home.
Another facet of the dataset (perhaps not fully realized) is that it includes carbon sinks and even CO2 injection.
Documentation, tutorials and help offerings are pretty good (by government standards). For a national-level overview, there are many good breakouts and analyses.
Of special interest to journalists may be
a look at the data offered on emitters
that have violated reporting requirements.
Of special interest to journalists may be a look at the data offered on emitters that have violated reporting requirements, or those who are blocking data disclosure with claims of trade secrets.
What’s missing (or imperfect) may be the small-scale or fine-detail emissions.
Reporters don’t have to do sophisticated data projects to make use of this data. They would be doing a lot by simply using it for reconnaissance.
Do you really know who are the biggest greenhouse gas emitters in your area, for instance? Once you have learned that, find out whether they are doing better or worse.
Joseph A. Davis is a freelance writer/editor in Washington, D.C. who has been writing about the environment since 1976. He writes SEJournal Online's TipSheet, Reporter's Toolbox and Issue Backgrounder, and curates SEJ's weekday news headlines service EJToday and @EJTodayNews. Davis also directs SEJ's Freedom of Information Project and writes the WatchDog opinion column.
* From the weekly news magazine SEJournal Online, Vol. 7, No. 16. Content from each new issue of SEJournal Online is available to the public via the SEJournal Online main page. Subscribe to the e-newsletter here. And see past issues of the SEJournal archived here.
SEJ Publication Types:
Topics on the Beat:
Region:
Visibility: